Don't invest unless you're prepared to lose all the money you invest. This is a high-risk investment and you are unlikely to be protected if something goes wrong. Take 2 mins to learn more.
Don't invest unless you're prepared to lose all the money you invest. This is a high-risk investment and you are unlikely to be protected if something goes wrong. .
£2.51bn across 2,421 companies: the UK's sub-£50m market posts its strongest second quarter since 2022
Syndicate Room
August 14, 2026
•
11 min read
For three years the UK's sub-£50m funding market has been flat
to the point of monotony. Around £8.6bn a year, holding steady through
political noise, rate movements and two Budgets. That is the segment UK
angels, EIS and SEIS funds actually deploy
into, and since the 2022 correction its story has been stability rather than
growth.
This quarter breaks the pattern. Between April and June, UK
private companies raised £2.51bn across 2,421 fundraises
below £50m: the strongest second quarter since 2022, and the first to pull clear of the £2.15bn level that held through 2023, 2024 and 2025. The number of
companies raising went up as well, which after a thinning field in 2025 may be
the more encouraging half of it.
Three headlines from the quarter:
2026 is tracking above the plateau.
Annual totals for 2023, 2024 and 2025 all landed inside £8.5–8.8bn. H1 2026 stands at £4.49bn, roughly 17% ahead of H1 2025, and puts our full-year forecast at £9.0–10.3bn.
The field stopped narrowing. 2,421 companies raised in Q2, up on the 2,224 of a year ago and the first Q2
increase since 2024, after funding events fell across 2025.
AI's real weight is 2.6× its label.
Pure-play AI companies raised £155m, while companies applying AI across fintech, SaaS, life sciences and beyond raised £397m. The AI story in this
market is embedded, not badged.
Q2 2026 in numbers
Q2 2026
Q2 2025
Read
Sub-£50m capital raised
£2,507m
£2,151m
strongest Q2 since 2022
Companies raising
2,421
2,224
up 8.9%
Average raise
£1.04m
£0.97m
rising
Mega-deals (£50m+)
11 cos / £1.65bn
11 cos / £1.94bn
same count, less capital
H1 running total
£4.49bn
£3.86bn
~17% ahead
One note on reading the year-on-year gaps: part of them reflects
our improved capture of very recent filings rather than market movement (see
the methodology note), so we would characterise the quarter as above the
plateau and rising rather than put a precise growth rate on it. The
direction is not in doubt. The decimal places are.
All figures in this report come from Sonde market data, our Companies House analytics platform, where the full quarterly dataset (sectors, stages, regions and methodology) updates each quarter.
£2.51bn
raised by sub-£50m UK private companies in Q2 2026, the first second quarter to break clear of the £2.15bn level that held through 2023, 2024 and 2025.
Three flat years, and a first sign of a turn
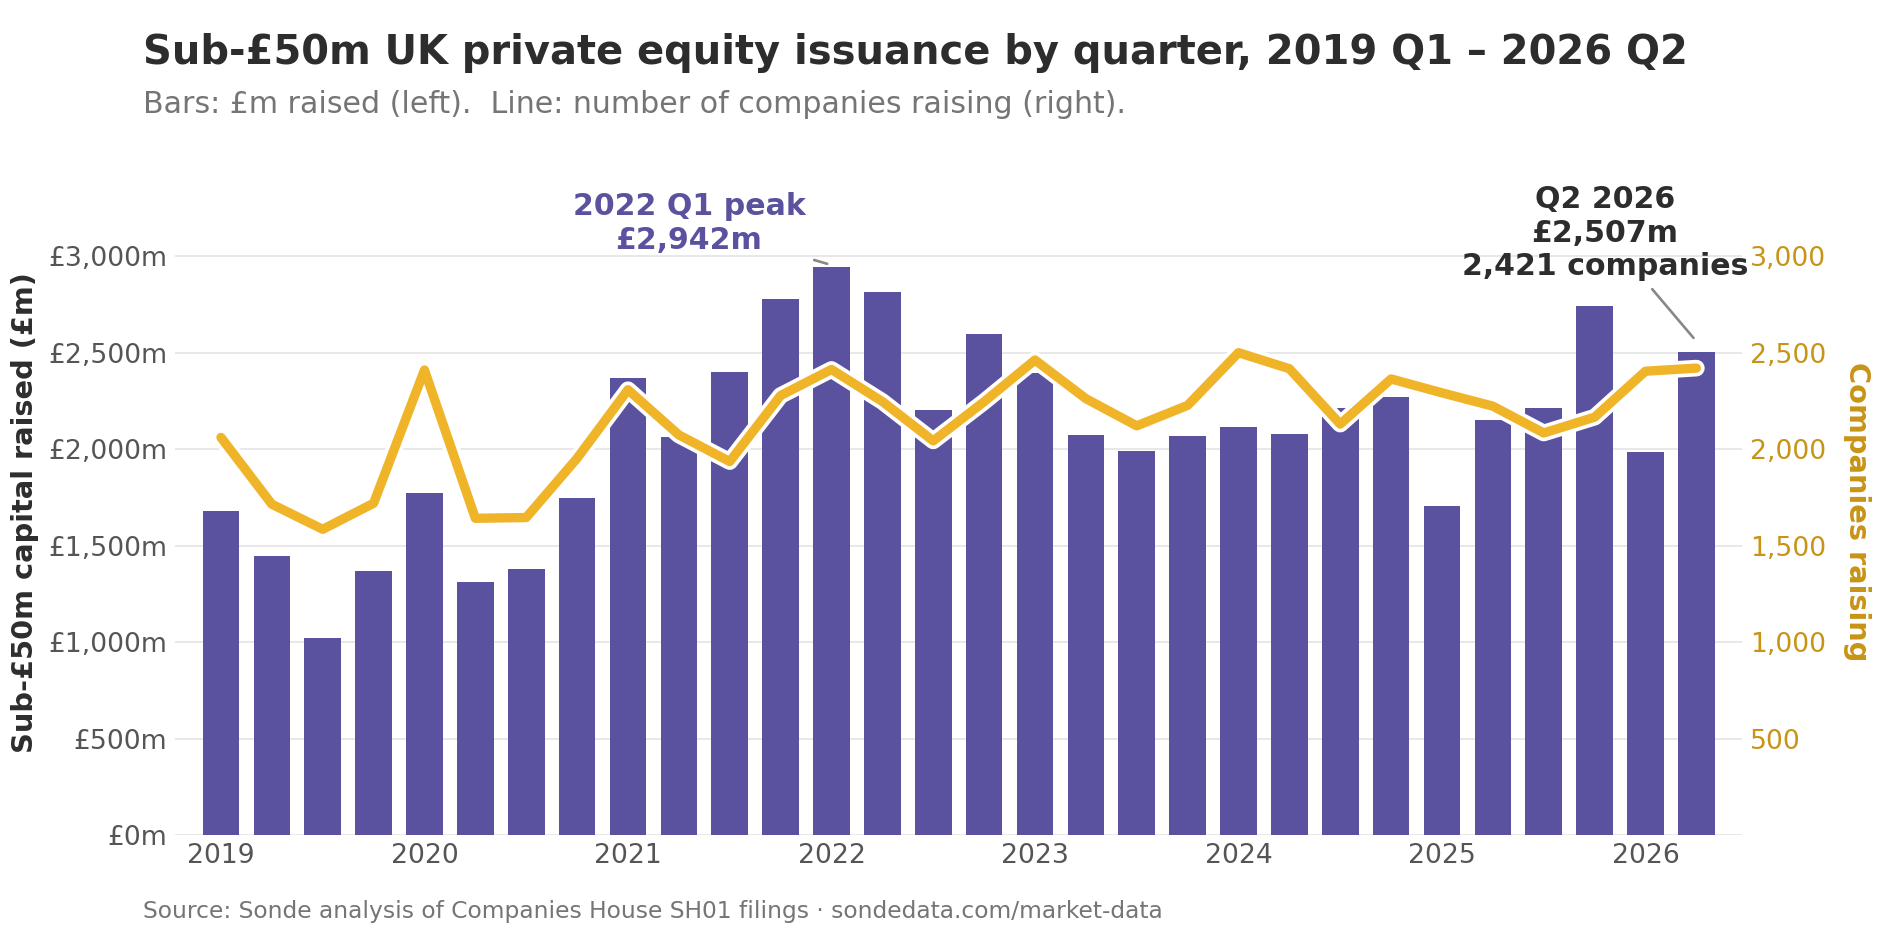
The quarterly series below is the single most useful view of the
dataset. Capital corrected sharply after the 2022 peak and then went flat: three years inside a narrow £8.5–8.8bn band, through
political noise, rate movements and two Budgets. Q2 2026 is the first quarter
to sit convincingly above that level.
The plateau was never static underneath. While capital held
flat, the number of companies raising it thinned, with funding events peaking
in 2024 at 9,415 before falling to 8,769 in 2025, and the money concentrated
into fewer, larger rounds. The average sub-£50m raise has climbed roughly 20% in two years, from £860,000 in Q2 2024 to £1.04m now. Within this quarter, the 408 companies we classify as Series B or later took £1.73bn, or 69% of all sub-£50m capital from under 17% of the companies. Series A companies raised £545m across 492 rounds, and seed companies £199m across 749.
That is consolidation: the same money, concentrated into fewer
hands. What makes Q2 2026 interesting is that both dials moved up at once,
with capital breaking above the plateau and the company count no longer
falling. One quarter is not a trend, and we would want to see the second half
confirm it. But it is the first quarter since 2022 in which the surprises
pointed upward.
HMRC's tax-relief data, which we covered
earlier this month, independently corroborates the consolidation half of
that story: EIS investment flat at £1.58bn in 2024–25 while subscriptions fell
for a third year and 4% of companies took 27% of the capital. Two datasets
with no shared methodology, pointing the same way.
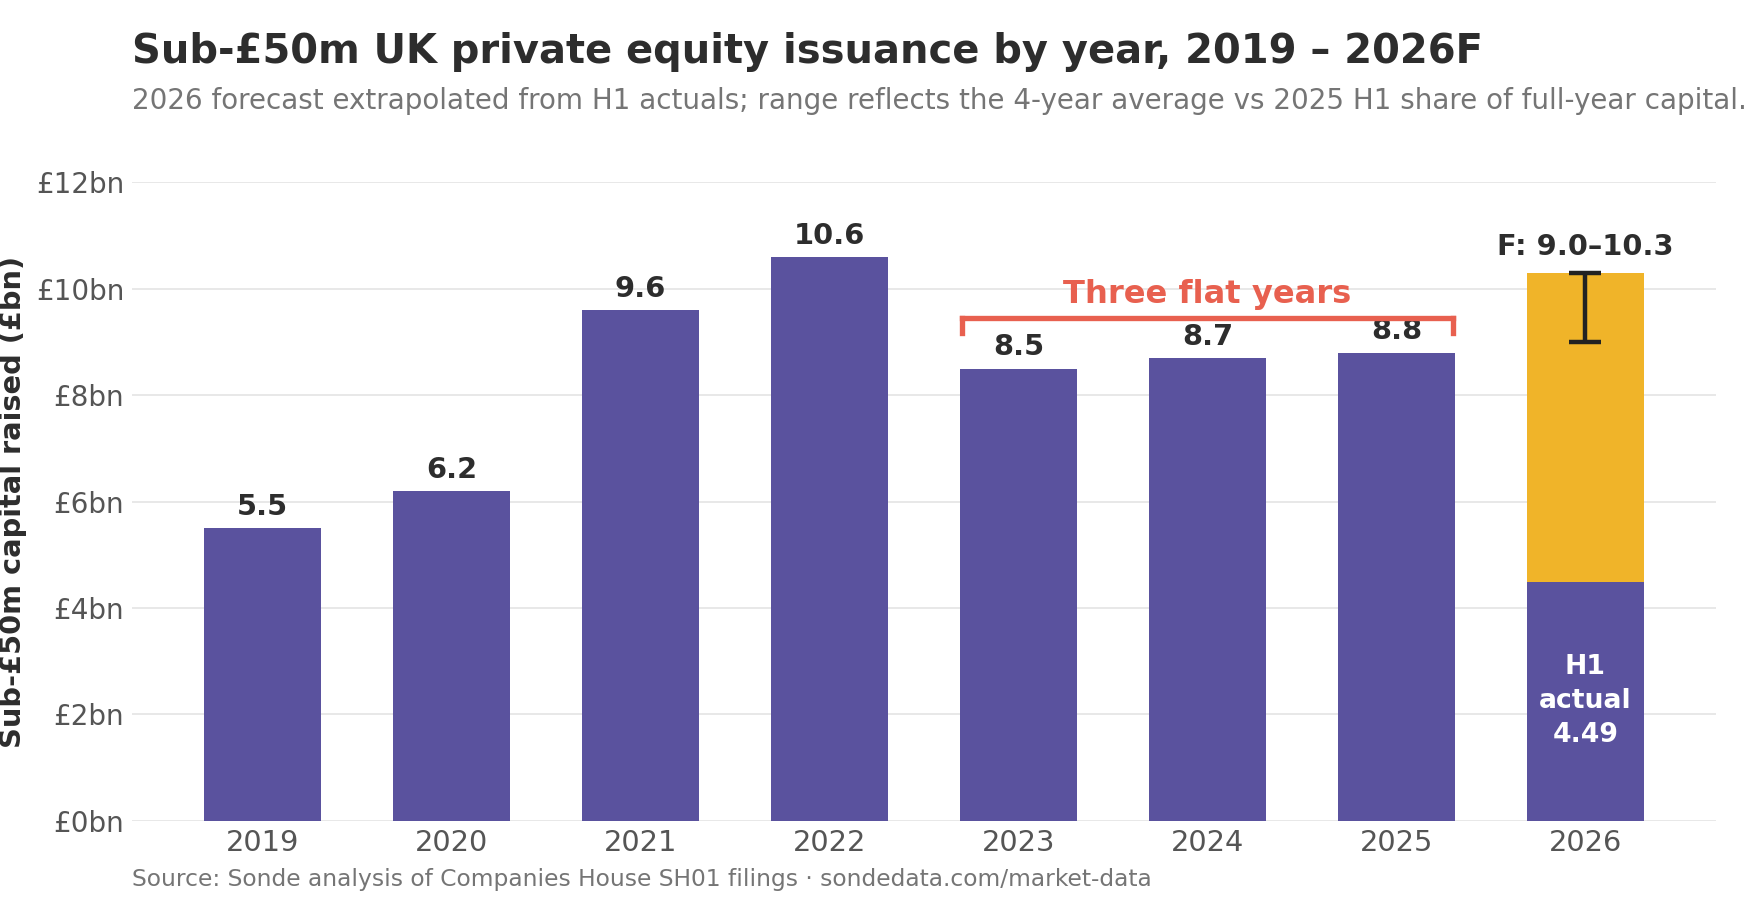
Annual sub-£50m capital peaked in 2022, corrected into the £8.5–8.8bn band in 2023, and has sat inside it since, ending 2025 at £8.8bn. Funding events tell the concentration story: a
2024 peak of 9,415, down to 8,769 in 2025.
H1 2026 stands at £4.49bn across 4,826 funding events, roughly 17% ahead of H1 2025 on capital.
The capital forecast is a range rather than a point, because the
H1 share of annual capital has been sliding, from around 55% in 2022 to 44% in
2025. On the four-year average share, 2026 lands near £9.0bn.
On last year's H2-heavy pattern, near £10.3bn. Both ends of that range sit above 2025's £8.8bn, which is a very different sentence from the
one we wrote in June, when our extrapolation pointed below £7bn (more on that
revision below). I do not expect a return to the 2022 peak. But for the first
time in this series, the risks to the forecast look tilted up rather than
down.
Three flat years was perhaps not a market in decline. It was a market consolidating: the same capital, concentrated into fewer companies. What this quarter changes is the direction of surprise. For the first time since 2022, the numbers came in above the level, not below it.
Graham Schwikkard|CEO, SyndicateRoom
Where the capital is going
The sector ordering held from Q1, with movement inside it.
Fintech remains the largest named sector by capital and extended its lead.
Life sciences, aggregated across biotech, healthtech and medtech, sits just
behind it. SaaS gave up the most ground on capital, and energy grew fastest from a low base.
Sector (sub-£50m)
Q2 2026
Q1 2026 (recomputed)
Direction
Fintech
£351m / 175 cos
£213m / 179
▲ capital +65%
Life sciences (combined)
£334m / 226 cos
£340m / 275
≈ flat
SaaS
£196m / 200 cos
£305m / 230
▼ capital −36%
AI (pure-play)
£155m / 72 cos
£179m / 86
▼ capital −13%
Deeptech
£98m / 55 cos
£95m / 58
≈ flat
Energy
£77m / 52 cos
£30m / 55
▲ capital +157%
Life sciences = biotech (£205m) + healthtech (£91m) + medtech (£38m). Every company sits in one sector only. Q1 figures are recomputed on this quarter's data basis, so the comparison measures the market rather than a change of method. See methodology note.
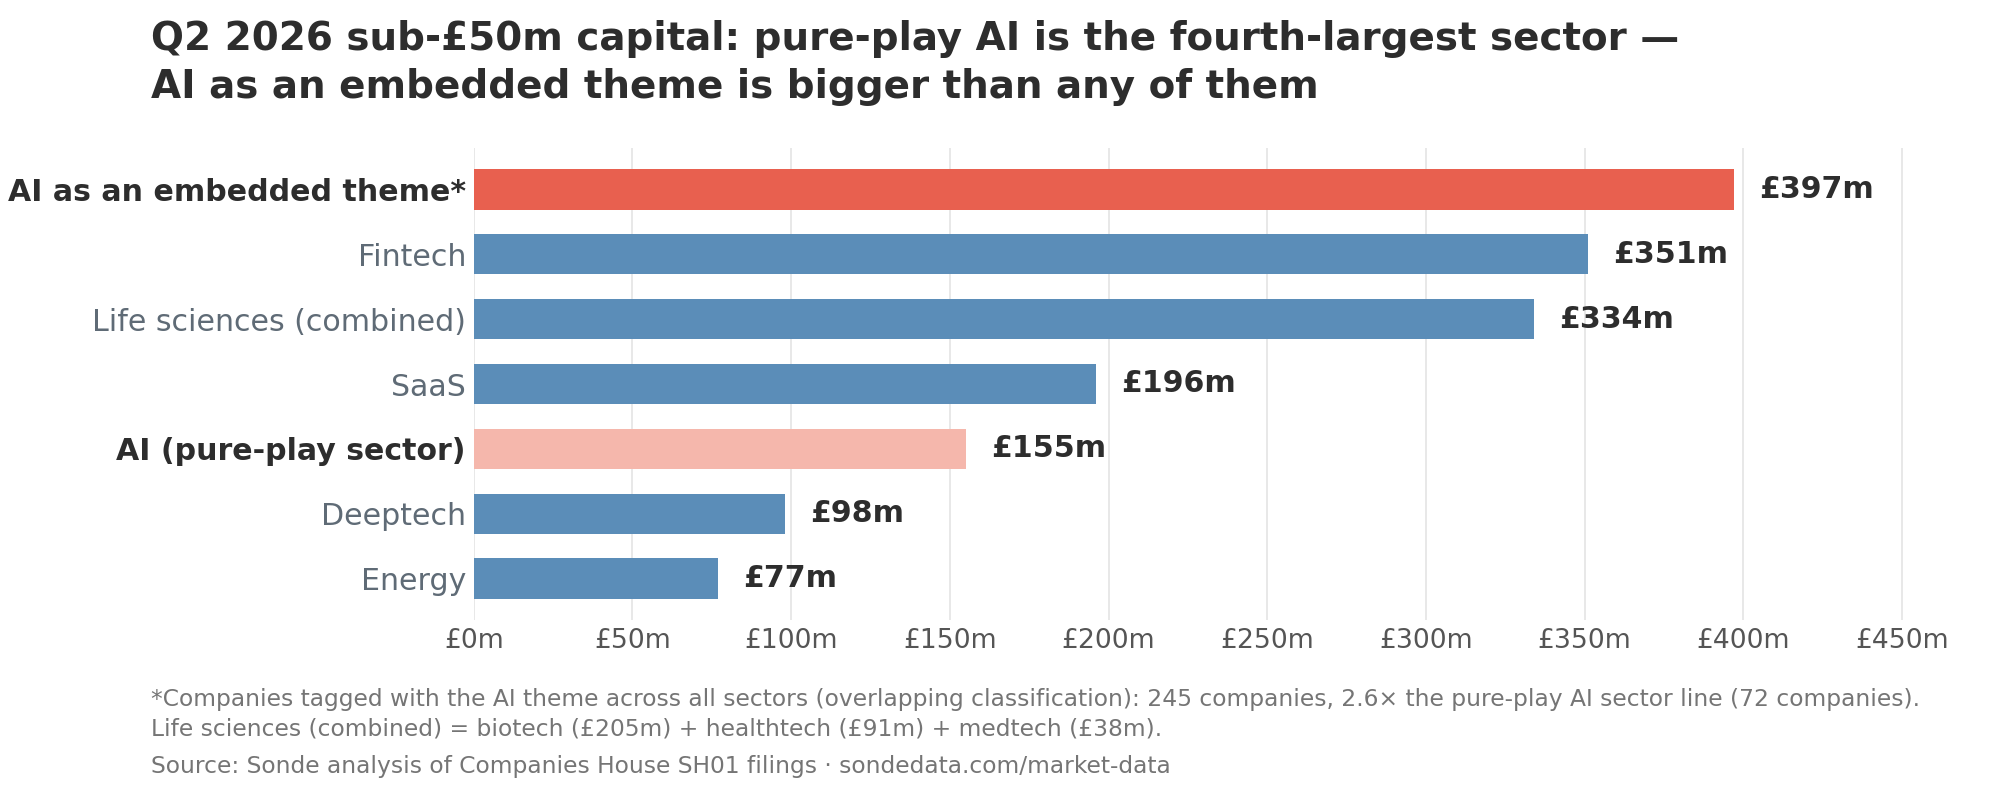
Pure-play AI came in at £155m, down on a recomputed first quarter, though around 60% of the line still rests on two rounds: Conduct AI (£47.2m) and Wayve (£44.3m).
The broader and more durable measure is our thematic tagging, which identifies
AI wherever it appears rather than only where it is the company's headline
identity:
Companies applying AI, inside fintech, SaaS, drug discovery,
deeptech and beyond, raised £397m across 245 sub-£50m companies in Q2: 2.6 times the pure-play line, across more than three times the companies.
This is the argument we made qualitatively in Q1, now with a number on it. Put
simply, an investor who wants AI exposure in the EIS-accessible market gets
more of it, more diversified, by backing the sectors deploying AI than by
hunting for companies with AI in the name. And the direction is encouraging:
the AI theme's £397m makes it larger than any single named sector in the segment, fintech included.
The top end: two real rounds among the eleven
Eleven companies raised £50m or more in Q2, totalling £1.65bn, but only about £374m of it is genuine UK venture capital:
PhysicsX's £190m (a $300m Series C led by Temasek at a $2.4bn valuation,
announced in June) and Fractile's £184m (a $220m Series B). Both, notably, are
AI companies. The pure-play AI story is real; it is simply happening at the
top of the market.
The rest of the mega layer is not venture at all. The largest single entry is a US parent capitalising a new UK subsidiary; behind it sit the £166m Depop entry (a change of corporate ownership arriving in the statutory record as a share allotment, not a funding round), further foreign-parent transfers, a defence joint-venture capitalisation, an aerospace build-out and intra-group movements.
What this means for advisers and allocators
The story has improved twice over, and it is worth
saying so plainly. In June we described a market in multi-year
decline. The fuller data showed a stable plateau instead, and this quarter
came in above it, with H1 2026 running ahead of H1 2025. One good quarter,
partly flattered by better data capture, is not a recovery. But the base EIS
portfolios deploy into looks firmer than at any point since 2022.
Concentration is still the number to watch. The
plateau years put the same capital into fewer companies, visible in our
filings, where 69% of this quarter's capital went to under 17% of companies,
and independently in HMRC's relief data. This quarter the company count
stabilised. Whether that broadening continues is, for early-stage allocators,
the more important question than the headline total.
On AI, the exposure is probably already there.
A portfolio built broadly across the segment's most active sectors picks up 2.6 times the AI exposure of a pure-play-only approach, across far more
companies. On this quarter's data, overweighting the pure-play label means
paying a premium for a badge.
Looking ahead
This is the second piece in our quarterly series tracking the
sub-£50m UK private market through statutory filings. Over the coming quarters
we plan to publish:
Regional mix: where capital is deployed outside London — the regional split is now live on the Sonde market data page, and we will test it against the geographic broadening in HMRC's data
Sector concentration over time: whether the fintech,
life-sciences and SaaS ordering holds across cycles
Funding-stage transitions: the 2021 cohort five years on,
against the 2018 cohort at the same point
If you are a wealth manager, IFA or institutional allocator who would find this data useful ahead of publication, you can get the quarterly briefing from the Sonde market data page — it lands roughly three weeks after quarter-end, ahead of most coverage.
Methodology note
Updated August 2026. This article was first published from a 27 July data pull. The figures above come from the 11 August pull, after a batch of previously unreadable filings was recovered. That recovery lifted Q2 2026 from £2.23bn to £2.51bn and, because it reached back through the series, lifted Q2 2025 from £2.06bn to £2.15bn as well — the comparisons remain like-for-like. Full detail is in the revision note on the Sonde market data page.
A note on the June forecast. Last quarter we
described sub-£50m capital as stepping down every year since 2022 and
projected a 2026 total below £7bn.
The data no longer supports either claim. Two things changed:
late-arriving and recovered filings lifted the recent quarters, and we
tightened our filters in ways that also corrected the historical series,
removing inflation in the older years that had made recent years look like a
decline. We publish roughly three weeks after quarter-end, ahead of most
coverage, and the price of being early is occasional revision. We think that
trade is worth it, and we will keep flagging revisions when they happen.
The dataset. This series is built on Sonde, our Companies House data platform. Sonde parses every SH01
(the statutory return of allotment of shares) lodged with Companies House by
UK private companies, going back to 2016. Each filing is the legal record of
new shares issued. We structure the filings, strip out those that are not
genuine private fundraising, and aggregate by company within each calendar
quarter, so a company filing multiple SH01s in a quarter counts once.
Across SH01s and CS01s Sonde has processed roughly 6.5 million filings; around 91,000 UK companies have a qualifying share allotment in this series. The series behind this article covers 30 quarters and roughly 64,000 company-quarter funding events, each traceable
to specific filings.
Filters. To isolate genuine private rounds from
corporate housekeeping we exclude: PLCs (public-market placings); allotments
at round par or nominal prices, which signal intra-group capitalisations;
filings with obvious filer errors (per-share price above £10,000 or totals
above £500m, capped or excluded); non-GBP allotments; companies whose latest
confirmation statement shows a single corporate shareholder above 50%,
indicating intra-group movements; and holding-vehicle entities (TOPCO / MIDCO
/ BIDCO / HOLDCO naming), which are financing-structure layers rather than
operating companies.
Where a filing has been formally corrected via a later RP04, we
use the corrected values and exclude the superseded original. "Mega-deals" are
companies raising £50m or more in a quarter, reported separately because a
handful of outsized entries otherwise swing the totals.
Download your Carbon13 SEIS Fund brochure
Carbon13 seeks to meticulously craft investment portfolios that not only navigate the complexities of high-emission sectors but also propel the groundbreaking ventures of tomorrow. Register to download the brochure.
Related Articles
Article
Loading article title placeholder that wraps onto multiple lines
1 Jan 2026 • 10 min
Read article
Article
Loading article title placeholder that wraps onto multiple lines
1 Jan 2026 • 10 min
Read article
Article
Loading article title placeholder that wraps onto multiple lines
1 Jan 2026 • 10 min
Read article
About the author
Syndicate Room|
Syndicate Room is authorised and regulated by the Financial Conduct Authority.
Investing in early-stage businesses involves risks, including illiquidity, lack of dividends, loss of investment and dilution, and it should be done only as part of a diversified portfolio. Tax relief depends on an individual’s circumstances and may change in the future. In addition, the availability of tax relief depends on the company invested in maintaining its qualifying status. Past performance is not a reliable indicator of future performance. You should not rely on any past performance as a guarantee of future investment performance.
This page has been approved as a financial promotion by Syndicate Room Ltd, which is authorised and regulated by the Financial Conduct Authority (No. 613021).
We use cookies to improve our service. By continuing to use this site you are agreeing to their use. Find out more. .