Don't invest unless you're prepared to lose all the money you invest. This is a high-risk investment and you are unlikely to be protected if something goes wrong. Take 2 mins to learn more.
Don't invest unless you're prepared to lose all the money you invest. This is a high-risk investment and you are unlikely to be protected if something goes wrong. .
The perpetual growth of the UK startup market and how to access it
Graham Schwikkard
July 19, 2026
•
13 min read
UK startups deliver consistent growth of 25-31% annually, but most VC funds
do not hit these numbers. We created the first ever index of the UK startup
market to investigate how investors can gain access to the highest-growth
startups and optimise their growth potential. If you don’t have time to read
the full article, we’ll be hosting a webinar
on this subject on 3 November
The UK is known as the startup capital of Europe with many UK
startups going on to achieve unicorn status (currently, there are 51 UK
unicorns, according to Sifted).
Year on year, UK startups consistently deliver growth, but for investors the
challenge has always been how to gain access to this competitive and thriving
market.
In this article we’ve done a market first - we created an index of all
startups that raised capital from 2011-2015 and tracked their valuations to
2022. This is particularly helpful to all investors who want to understand the
overall market trends and how it changes year to year.
On the basis of this index, there are important lessons to be learned when
approaching investing in startups. Diversification across the cohorts,
diversification within the cohorts, and the importance of how you access the
market all factor into the approaches investors should consider – and those
they should avoid – in order to ensure their startup portfolio is as
growth-optimised as possible.
Why is an index important?
Because it’s difficult to get a sense of how much growth the UK startup
market sees annually without it. Unfortunately, the startup market is opaque
at best. There’s nothing to show how UK startups are doing, and all investors
have to rely on are the overtures of VC funds about the companies on their
books, with relatively little information about how those companies have
performed over time compared to the broader market. Hints, whispers, promises,
good startups over there, better ones over there, but no real evidence and
little data to actually demonstrate how to approach startup investing in order
to obtain the best results for the individual investor.
This is why most private investors rely on seasoned stock pickers – venture
capitalists – who will go into the deeper waters and hunt down the startups
they think have the most potential. However, most funds will often then limit
their portfolio size to a handful because of the time and effort that goes
into searching for the promising signs of life that they hope will grow into
big fish. Unfortunately, no index means it can be hard to track how good any
given VC’s catch of promising companies has been.
Indexing the UK startup market
In the UK, each company is required to file when they raise capital and say
how many shares they have in issue and what price per share they sold the
shares at. It doesn’t capture every transaction because some investors will
invest via convertible loan notes or advanced subscription agreements, but
those will eventually convert (or not and then they are not equity and so not
relevant for this exercise) and are not so prevalent that it would make a huge
difference when considering every single startup in the market.
If we multiply these values out (the share price and number of shares in
issue) we can get a valuation per startup and then of the whole market. So
that’s what we did.
How we indexed the 2011-2015 cohorts
There is a slight nuance to indexing the startup market. In public markets
IPOs are relatively rare (especially in the UK right now). But new startups
form all the time, and sometimes their valuations grow rapidly. If you track
the valuation of all startups that exist, the chart would be skewed by new
formations and wouldn’t tell you that much about the performance of the
market.
This is why we focus on cohorts – every company that raised capital in a
particular year. We try to focus on investable rounds, so we only include
companies that raised at least £100k at a valuation under £50m. It is actually
tough for most investors to get into rounds where valuations are creeping to
£50m, but as VCs are investing into those rounds we have included them.
If you reduce that number to £25m the growth rates actually increase (why?
Well it’s because the companies have more runway for growth and companies with
higher valuations tend to grow slower. See my second white paper on the power law
for more). Any company that goes into administration is marked at zero, as are
companies that are not showing any activity and are classified as zombies.
Finally, although we have values for 2023, I’ve excluded them here because
there is always a filing delay between funding and filing with Companies
House. Moreover, we need companies to have funding rounds to reflect the
market and that takes time so it’s better to do this on a delay.
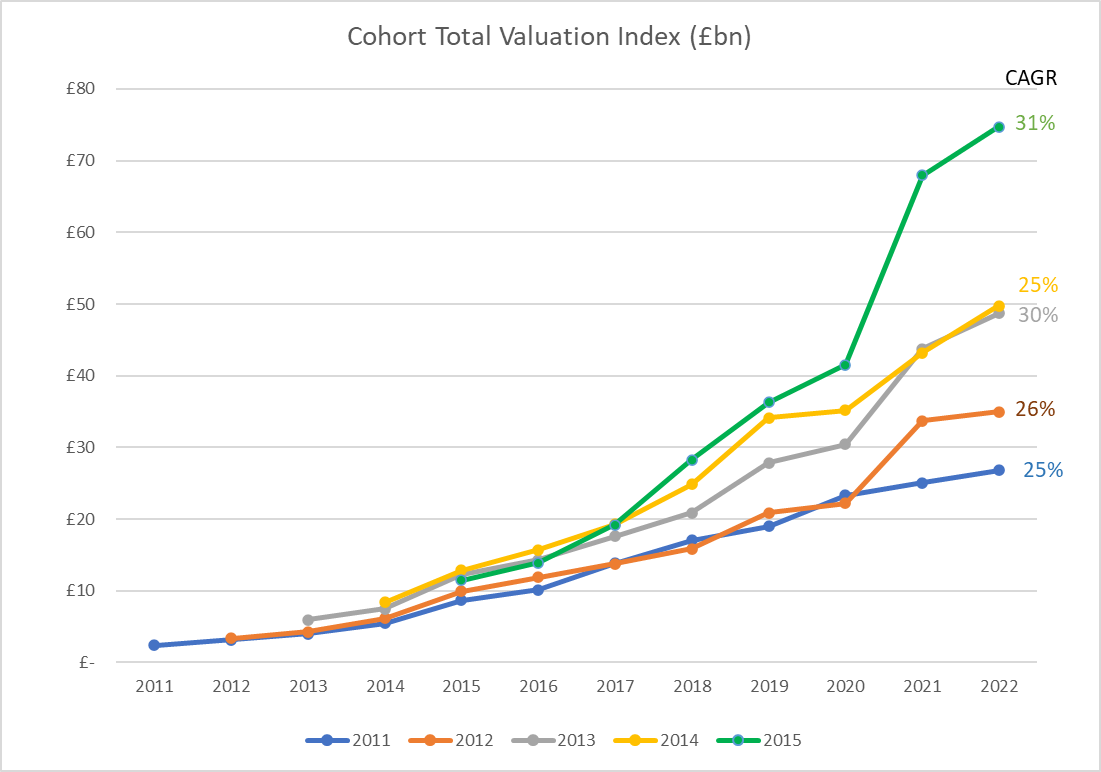
Total valuation index
You’ll find our index of the startup market by valuation below:
You will note that each cohort starts at a different point. This is because
the total valuations for that year depend on which companies raised capital in
that year. If there are a lot of companies that meet the criteria I laid out,
then the starting valuation will be higher.
What does it show?
The UK startup market has been growing steadily since 2011, both in terms of
number of deals and total value invested.
The 2015 index starts at about 5X the value that the 2011 index starts at.
The fastest growing index is indeed 2015 and although there are a lot of
successful startups in that cohort, the big ones driving it are Revolut
(valued at £4m in 2015 and completed a £25bn round in 2011), Bought by Many
(valued at £12m in 2015 and £1bn in 2021) and Monzo (valued at £7m in 2015 and
£2.6bn in 2022).
Venture capitalists often talk about a J curve when investing. It means that
you will often see minimal or even negative growth in your portfolio as the
startups are still looking for traction and many will actually die. We don’t
quite see this in the market data, although early year growth is slower than
that in later years if only because it takes a later stage round to reflect
the increase in valuation (so it’s better to invest early). I think we don’t
see it because the data will include companies that are quite at different
stages and ages. The valuation range restriction helps with this, but it won’t
be the same as a seed stage VC who specifically chooses startups that have
just formed and have just done a single funding round. It might be an analysis
for a future date.
Comparing each cohort, although they do have different growth rates, it’s
remarkable how consistent they are with all growing between 25-31% annually.
We can also observe that 2020, the covid year, was not great for valuations
with overall growth “just” 10% across cohorts. But valuations bounced back 40%
the following year. There are many signs that 2023 is going to be a slower
year similar to 2020 driven by tough market conditions. Could it be an
opportunity though? We will have to see.
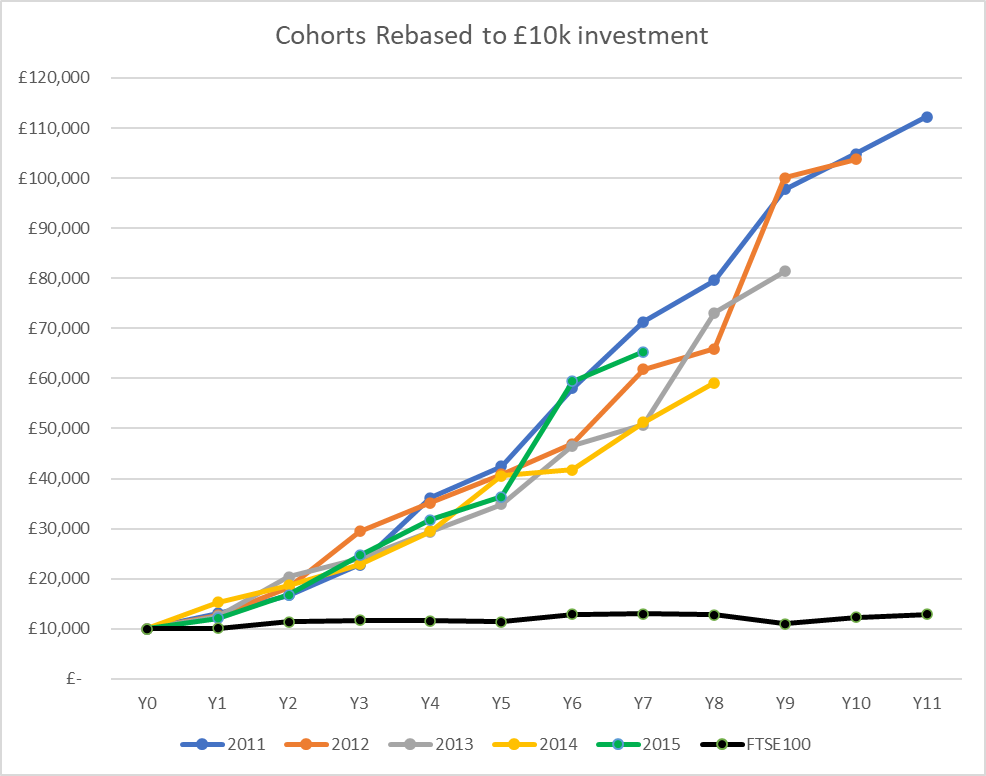
Valuations indexed to £10k investment, benchmarked against
FTSE
The different starting points for each cohort make comparisons a bit more
difficult, so to draw better conclusions I indexed the valuations to a £10,000
investment. So if you had been able to invest £10,000 into each cohort (you
can’t, so this is theoretical), what valuation growth would you expect? Note
the growth rates for this will be the same, and each cohort will have had less
time to mature so 2015 will only go to year seven. Viewing it in this form
further illustrates the consistency of the index growth, but also the start
difference in value accrual in this section of the private market compared to
the FTSE.
Once again, the overall growth is quite stellar – a £10k investment in the
2011 cohort would be valued at £112k by 2022. As most of these investments
would be EIS qualifying, this does not even include the original £3k income
tax relief, and there would be no capital gains due on the investments.
Indeed, across the cohorts we see the consistent 25-31% annual growth pushing
that £10k towards >£100k after 10 years.
Now it’s very important to point out that these are not liquid investments –
you would not have been able to sell the full holding after year five. Many of
the largest companies on this index have exited, and in those cases we kept
their valuation flat from the point of the exit. If we restrict the cohorts to
exits only, then we see more moderate growth of around 20% per year from the
original £10k invested.
Compared to most other investments that is still excellent and there is the
prospect that these other investments exit, especially if they are showing
strong valuation growth. Indeed we often can’t track any secondaries that may
have occurred – this is when late stage investors offer to buy out early stage
investments – and they are quite common for high growth companies.
Why compare it to the FTSE when one is liquid and the other isn't? The point we want to highlight here is where the value accrual is. Most investors are restricted to public equities and the growth over a 10 year period in the FTSE is very poor compared to the venture market which is private and hard to access. £10k going to over £100k means that there is a lot of wealth being created, and most of it is being missed by the majority of investors. We believe more investors should be accessing this market and including it in their portfolios.
A few more observations
The power law is very much at work on this index.
The top 6% companies make 80% of the value at the final point in time.
Valuations continue to grow for quite some time – these investments take
a long time to mature
The final value of all the cohorts was £181bn (FTSE market cap is £2
trillion), with an average £3bn invested in the cohort every year
So what can we do?
In an ideal world we would simply create an index and invest £10k
proportionally into the underlying companies. The growth is consistent and
stronger than most other asset classes. But unfortunately it is not as simple
as that for two reasons. Firstly, these are private companies and they can
choose who to take investment from – you can’t simply find them on a list and
tell your broker to buy you some shares. Secondly, you need to invest in them
before they are big and often be involved with them before they even raise
their rounds.
Having said that, there are very clear lessons we can draw from the index
On the basis that the UK startup market does see consistent annual growth
investors should:
1. Add venture to your portfolio to increase overall growth.
The index clearly demonstrates the huge value accrual in this sector of the
private market.
Are you accessing that as part of your portfolio? If you have one, does your
financial adviser consider it? Is your pension diversifying with some venture?
I hope this analysis has shown that these are very valid questions. I’ll be
bold and also say your focus should be on early-stage venture as this analysis
focuses on the early-stage deals. This often excludes VCT investments, which
tend to focus on generating dividends and later stage, lower risk (and lower
growth) firms.
The next question you should then ask yourself is how best to go about accessing the venture market.
2. Find a way to access the top of the venture market.
Since this is the private market it comes down to deal flow sourcing. I’ve written before about the importance of building the
right deal sourcing machine that leverages network connections and regular
activities to ensure you are seeing high-quality deal flow.
For most investors this is too time intensive and you should instead look to
venture capital funds who have a sufficient grasp of the importance of the
right kind of deal flow process. Make sure you understand their deal flow
machine when you do – access to the top 6% of deals at the right stage (i.e.
not just before their big valuation round) is paramount.
In our case, we use a lot of data to identify angels with the right deal flow
machine in place and simply invest where they invest. If you are going to try
and capture the growth in this market, you must look at how deals are being
sourced.
This probably goes without saying for most investors in this space - take
advantage of capital gains tax disposal relief from EIS investments. With so
much potential growth on the cards (though of course, not guaranteed) you will
want protection against capital gains tax. EIS investments are free from
capital gains tax on disposal as long as you make the initial income tax claim
on your investment, and they have been held for three years. If you don’t
claim income tax relief, you will not be able to claim the capital gains tax
break upon disposal of your shares.
3. Be smarter about how you invest in venture.
This is an index of all companies, so you need to consider how best to
capture the growth of an entire startup market.
A small portfolio of 10 companies won’t cut it - it will show far too much
variation to properly sample the index and will be heavily reliant on stock
picking which we already know from the public markets is a unreliable way to
beat the market. Go for diversified funds, or invest in a lot of funds and/or
companies.
Moreover, invest across cohorts to properly diversify. Our data analysis
identified a portfolio of 150 companies as a good number to balance growth
potential and mitigate variance . Our fund adds around 50 companies to each
investor’s portfolio over the course of each deployment.
Diversify within a cohort.
Yes I know we tend to repeat this point, but it keeps bearing true in our
analysis. If you can’t get the whole index, then your next best bet is to get
a good enough sample of the market that will capture the consistent growth.
This is not only so you can reflect the index, but so you increase your odds
of investing in that top 6% of companies. I did some modelling in my first white paper showing
how many companies you need in your portfolio and then did a second take in
our second white paper on power law
analysis. It will depend on what stage you invest at.
Diversification across cohorts.
The growth rate for each cohort is different. So far it’s shown to be within
a range but it does vary, and the timing of the growth and the exits varies
even more. If you are looking to reduce risk and increase consistency, it
makes sense to sample each cohort each year by making further investments in
EIS across different tax years.
Register for our upcoming webinar
We’ll be hosting a webinar that explores this subject matter further, with an
emphasis on how investors should revise their VC investing strategies based on
what indexing the startup market tells us.
Loading guide...
Related Articles
Article
Loading article title placeholder that wraps onto multiple lines
1 Jan 2026 • 10 min
Read article
Article
Loading article title placeholder that wraps onto multiple lines
1 Jan 2026 • 10 min
Read article
Article
Loading article title placeholder that wraps onto multiple lines
1 Jan 2026 • 10 min
Read article
About the author
Graham Schwikkard|CEO
Graham Schwikkard is CEO of SyndicateRoom, with over a decade of experience in data science and a fascination with the dynamics of the startup investment network.
Investing in early-stage businesses involves risks, including illiquidity, lack of dividends, loss of investment and dilution, and it should be done only as part of a diversified portfolio. Tax relief depends on an individual’s circumstances and may change in the future. In addition, the availability of tax relief depends on the company invested in maintaining its qualifying status. Past performance is not a reliable indicator of future performance. You should not rely on any past performance as a guarantee of future investment performance.
This page has been approved as a financial promotion by Syndicate Room Ltd, which is authorised and regulated by the Financial Conduct Authority (No. 613021).
We use cookies to improve our service. By continuing to use this site you are agreeing to their use. Find out more. .